National
(Census page reference)
number of farms
%
hectares
harvested
%
metric tons
harvested
%
1,436
30,860
511,900
564
24,400
413,400
Volume 1: National, State, and County Tables
(released March 1999)
(Acrobat Reader (free) is necessary to access Census data links below)
| Ranked below are the primary sweetpotato growing states which account for 99% of US sweetpotato production. Also ranked are the four main sweetpotato producing regions where 20 counties account for 78% of US total production. Click on the map for more details. | |||||||
|
|
|||||||
|
National |
number of farms |
% |
hectares |
% |
metric tons |
% |
|
| United States (p. 16) | 1,770 | 100 | 31,320 | 100 | 518,000 | 100 | |
| 11 top producing states |
1,436 |
81 |
30,860 |
99 |
511,900 |
99 | |
| 20 top producing counties |
564 |
32 |
24,400 |
78 |
413,400 |
80 | |
| Region 1: Four-state
sweetpotato belt along the Gulf of Mexico The four states below harvested 46% of the USA sweetpotato acreage. This region's main sweetpotato counties, accounting for 39% of the US harvest, are shown with their national rankings. |
||||
|
|
||||
|
US ranking, |
Census file size (page reference) |
number of farms |
hectares |
metric tons |
|
2) Louisiana |
2.0 MB |
138 | 7,480 | 122,800 |
|
Main Counties: |
5) West Carroll | 36 | 2,110 | 35,910 |
| 8) Morehouse | 8 | 1,290 | 19,100 | |
| 9) Avoyelles | 36 | 1,160 | 21,400 | |
| 10) Evangeline | 13 | 820 | 10,210 | |
| 13) St. Landry | 15 | 720 | 9,880 | |
|
3) Mississippi |
2.5 MB |
68 | 3,580 | 46,800 |
|
Main Counties: |
2) Calhoun | 29 | 2,600 | 33,110 |
| 14) Chickasaw | 17 | 700 | 10,590 | |
|
5) Texas |
7.8 MB |
92 | 1,990 | 31,840 |
|
Main Counties: |
12) Van Zandt | 26 | 730 | 13,300 |
| 16) Wood | 16 | 580 | 8,380 | |
| 19) Rains | 9 | 380 | 7,200 | |
|
6) Alabama |
2.1 MB |
112 | 1,410 | 19,260 |
| Main Counties: | 11) Baldwin |
16 |
750 |
9,720 |
| 20) Cullman |
35 |
330 |
5,530 |
|
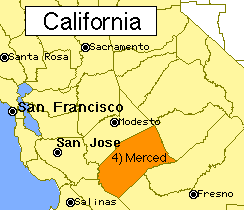
Region 3:  California
accounts for 9% of the sweetpotato acreage harvested in the US.
Merced County accounts for 82% of California's sweetpotato harvest,
and is the USA's fourth ranking sweetpotato county. California
accounts for 9% of the sweetpotato acreage harvested in the US.
Merced County accounts for 82% of California's sweetpotato harvest,
and is the USA's fourth ranking sweetpotato county. |
||||
|
US ranking, |
Census file size (page reference) |
number of farms |
hectares |
metric tons |
| 4) California |
2.3 MB |
100 |
2,840 |
59,960 |
|
Main County: |
4) Merced | 72 | 2,320 | 51,190 |
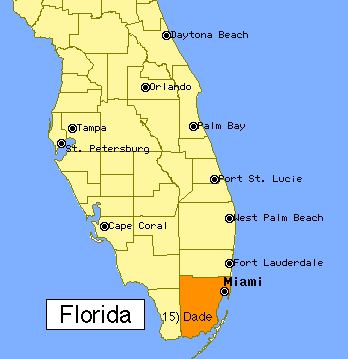
Region 4:  Florida
accounts for 2% of the sweetpotato acreage harvested in the US.
Dade County accounts for 93% of Florida's sweetpotato harvest,
and is the USA's 15th ranking sweetpotato county. Florida
accounts for 2% of the sweetpotato acreage harvested in the US.
Dade County accounts for 93% of Florida's sweetpotato harvest,
and is the USA's 15th ranking sweetpotato county. |
||||
|
US ranking, |
Census file size (page reference) |
number of farms |
hectares |
metric tons |
| 7) Florida |
2.2 MB |
36 |
640 |
11,090 |
| Main County: | 15) Dade |
10 |
590 |
10,570 |
|
The four states below account for 21% of US sweetpotato farms, harvesting 4% of the US sweetpotato acreage. |
||||
|
US ranking, |
Census file size (page reference) |
number of farms |
hectares |
metric tons |
| 8) New Jersey |
0.8 MB |
76 |
360 |
4,490 |
| Main County: |
Atlantic |
20 |
130 |
1,780 |
| 9) South Carolina |
1.5 MB |
112 |
300 |
3,600 |
| Main County: |
Horry |
24 |
140 |
2,060 |
| 10) Georgia |
4.6 MB |
87 |
270 |
4,070 |
| Main County: |
Bibb |
3 |
6 |
90 |
| 11) Virginia |
3.1 MB |
103 |
250 |
2,870 |
| Main County: |
Accomack |
13 |
160 |
2,250 |
Copyright by Barry Duell, 1999. Updated September 6, 2000.